
The Duck Curve, synchronous generators and renewable energy
Installed rooftop solar will soon generate more power than Australia’s remaining coal plants, that’s over 20GW of combined grid-connected capacity! There’s clearly a lot of rooftop solar, but how does it affect the whole grid system? This blog discusses how the demand curve has changed over the last 10 years and the change in energy generation curves between generation technologies.
The Duck Curve
A rather well-known image of the electricity demand curve is referred to as “the duck curve”. It originates from the California Independent System Operator (CAISO) (essentially the AEMO of California) which published the below chart in 2013, displaying energy demand on a spring day. The chart also showed CASIO’s prediction of how the demand curve would change in the coming years.

Source: http://www.caiso.com/
The overnight demand in megawatts remains relatively stable over the 7-year projection; except for a slight increase, likely due to increasing population and rising connections to the main electricity grid. From about 8 am the demand curve begins to fall, dipping around midday and early afternoon; the curve falls deeper as the years progress. The drop in demand is due to an increase in small-scale solar generation (ie. rooftop solar) throughout the day and greater adoption over the years. Rooftop solar allows households to use their own generated power during the day and therefore fewer households are relying on energy from the main grid. However, they can only produce their own electricity during the day and still rely on the grid when the sun isn’t shining. Demand for electricity from the main grid then increases as the sun sets and more people return home from work, causing an evening peak in demand at around 6 pm.

Generators have to cope with steep ramp-ups and ramp-downs to accurately meet the electricity demand, which is commonly the case in the evening peak. It is challenging for grid generators and operators to balance because it means a huge amount of generation capacity coming online very rapidly. Many elements of the grid infrastructure were designed for traditional synchronous generators and a smooth demand curve. The extreme demand curve is not only taxing on infrastructure, but it also becomes uneconomical for traditional synchronous generators. If they can’t ramp up quickly to meet this demand, they need to generate all day, regardless of whether they can sell the electricity during the day. This leads to things like over-supply and negative electricity pricing.
Of course, demand doesn’t always look like the predicted graph – it changes day to day, and because of the renewable behind-the-meter generation, even depends on the weather. That said, it does usually follow the two demand peaks: a small one in the morning and a big one in the evening.
Supply Curves
So, if the demand curve looks like a duck, what does the supply curve look like? Well, it’s different for every form of energy generation, and that’s why the transition to a 100% renewable energy grid is not simple.
The NEM has over 100 different generation companies, including synchronous thermal power stations and renewable energy. Different types of generators have different generation supply curves, of varying intermittency and flexibility. Variation may even occur within one type of generator; solar PV farms across the grid will vary in generation depending on climate, weather, maintenance, and more.
Below we discuss the typical generation curve of synchronous generators, solar, and wind power.
Synchronous generators
Generators such as thermal power stations have a fairly smooth generation curve. You can view live power generation at OpenNEM- Often, through OpenNEM, you can observe coal power generators slightly increase generation of the morning peak and then more significantly ramp up for the evening peak. Synchronous generators were designed to run continuously and at a constant frequency, and hence their infrastructure and design do not allow quick ramp-up/down or shut down/start up (this is discussed in ‘Inertia, Synchronous Generators and Frequency’).
Solar generation
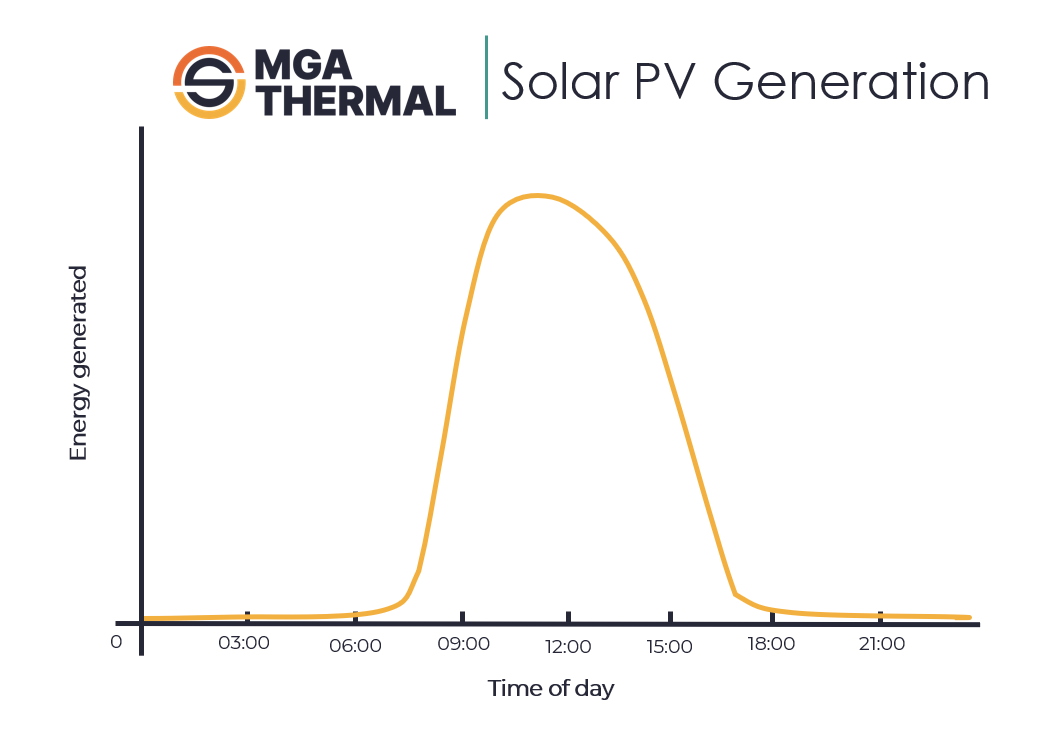
Typically, Solar PV generation begins as the sun rises and finishes as it sets. This creates a curve that generally looks like an upside-down u. Concentrated Solar Power has a similar curve, although it works through direct radiation, so the shape is closer to an upside-down v. Solar power generation can be fairly accurately predicted, through weather forecasts. There are also technologies that accurately predict when a cloud will be over the solar field and adjust for the drop in electricity generation.
Wind generation

The wind generation graph is an example of wind generation over a day. Wind power is less predictable than solar generation however we can predict broad trends according to weather events, seasons and years. Although the power generation is intermittent it still managed to be a 12.5% contribution to the NEM in the last year (OpenNEM, 1 year from 16/01/2023). Fortunately, solar and wind generation are independent and tend to combine well to provide a fairly continuous supply.
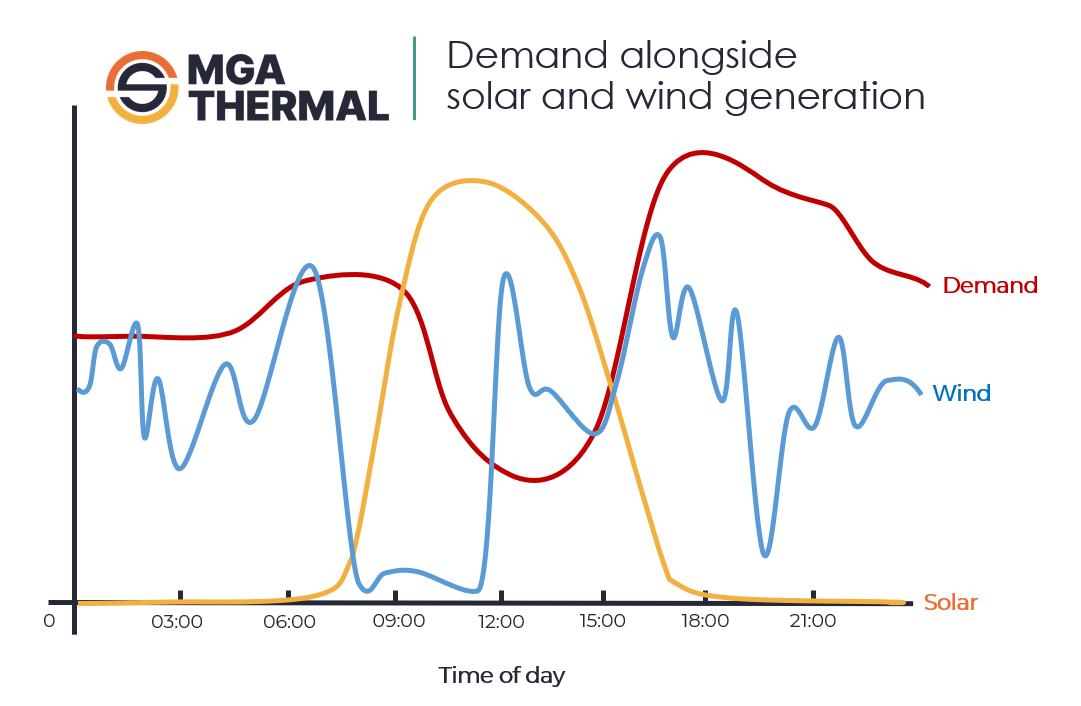
By overlaying demand with solar and wind generation, the peaks and troughs of mismatched energy generation and demand become evident. Supply often outweighs demand in the middle of the day, and demand often peaks in the evening just as solar generation drops off. We will discuss the typical results of an oversupply in a future article.
AEMO is the body that ensures the energy generation supply meets electricity demand, and as the example data shows, the energy mix to meet demand changes every day depending on renewable energy generation. To see real-time energy mix in consumption and generation visit OpenNEM. The energy mix will continue to change as new technologies emerge and existing ones become cheaper and more efficient. Currently, solar energy curtailment is a common practice to balance the energy mix and retain grid integrity. This basically means ‘switching off’ solar farms in the middle of the day to minimise over-supply. However, increasing the amount of energy storage on the NEM would allow intermittent renewable energy generators to produce in excess of energy spot demand and store it for evening peak consumption. Read about MGA Thermal’s energy storage solution here.
Published 03/03/2023 – MGA Thermal. Authored by Arden Jarrett.
A version of this blog was originally published on 18 May 2021.